

Last year at one of the parent-teacher conferences, a parent asked me exactly what her child would be doing in Grade Nine Geography, and added another question at the end, “They’re not still coloring maps are they?”, with a chuckle. I knew I could not answer “yes” to this question, even if I was still having the kids color maps. But since the pandemic I had moved towards using chromebooks more and more. But now our chromebook inventory is getting less and less due to a number of factors (check out the post, Chromebook Abuse And How To Manage It) I will often give the students the option to use digital or use old school pencil to paper. In my opinion there is nothing wrong with putting pencil to paper. It’s cathartic and soothing and sometimes the kids need that!
Since my school board has invested in the use of the Google Suite of products, that of course comes with Google Drawings and Google Slideshow. These applications have been around for about 15 years and both have the ability to create charts, tables and diagrams.
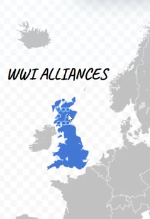
In Geography and History these apps have come in handy many times. A colored map with a good legend makes for a great informational visual. Anywhere from a map showing the military alliances of the Triple Entente and the Triple Alliance to help understand how WWI was a war fought on two fronts, to drainage patterns of a particular river or the types of land use in an area.
Both Google Slideshow and Google Drawings have the ability to outline and color objects. However, the one drawback with using Google Slides is that once your map or other image that has been colored, the image itself cannot be saved as a jpeg or png. Instead it is the slide which is saved as the jpeg or png. But if you use Google Drawings, you can save your image alone. So this is my choice when tasking the students with creating a thematic map.

The coloring tools in Google Drawings that I have found most useful for coloring maps are the polyline, curve and scribble tools. The curve and scribble options are very easy, but limited in use on a map, except for roads and a few other shapes.
It is the polyline tool that is the most useful, although it can be frustrating at times as it is not without glitches. This is especially if you are trying to outline a really complex shape. Complex shapes with lots of starts and stops can ultimately fail. The answer to this is to create many polyline shapes within the larger shape and color each individually. It is definitely much more work, but looks great in the end. An example is when I wanted to shade Great Britain, an island with lots of curves and angles. What I did was to create many polyline shapes. Take a look at the stages below:

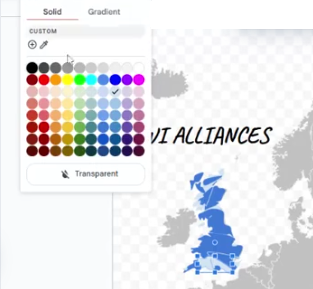
When using this tool, the shape will automatically change to a pale blue color once the shape has been closed by the meeting of your lines. When using the polyline and color, you want to be sure to not only color the inside of your shape, but also the outline of the shape. It sounds strange, but the two are different, and will be different colors unless both are changed to the same color. Here is another example:
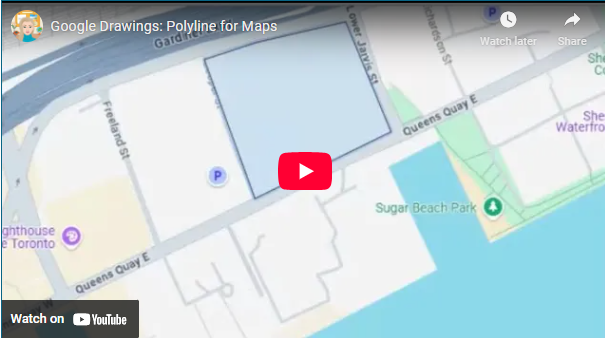
I have a full video on the YouTube channel (the channel is kind of in it’s infancy like this blog!) and I go through not just tips for thematic maps but also map shading techniques for choropleth maps in Google Drawings in real time.
Wishing you the best for all your teaching moments,